
As of the end of March 2025, 1.34 million households were on local authority housing registers in England, the highest number recorded since 2014.1
But for wheelchair users and people with mobility needs, finding a home is only part of the challenge. It also needs to meet their individual accessibility requirements.
Making matters even more challenging, there is currently no complete national picture showing how many wheelchair-user households are waiting for suitable accessible housing. That’s because government data on this waitlist is limited, as councils use different systems and definitions to record accessibility needs and suitable properties.
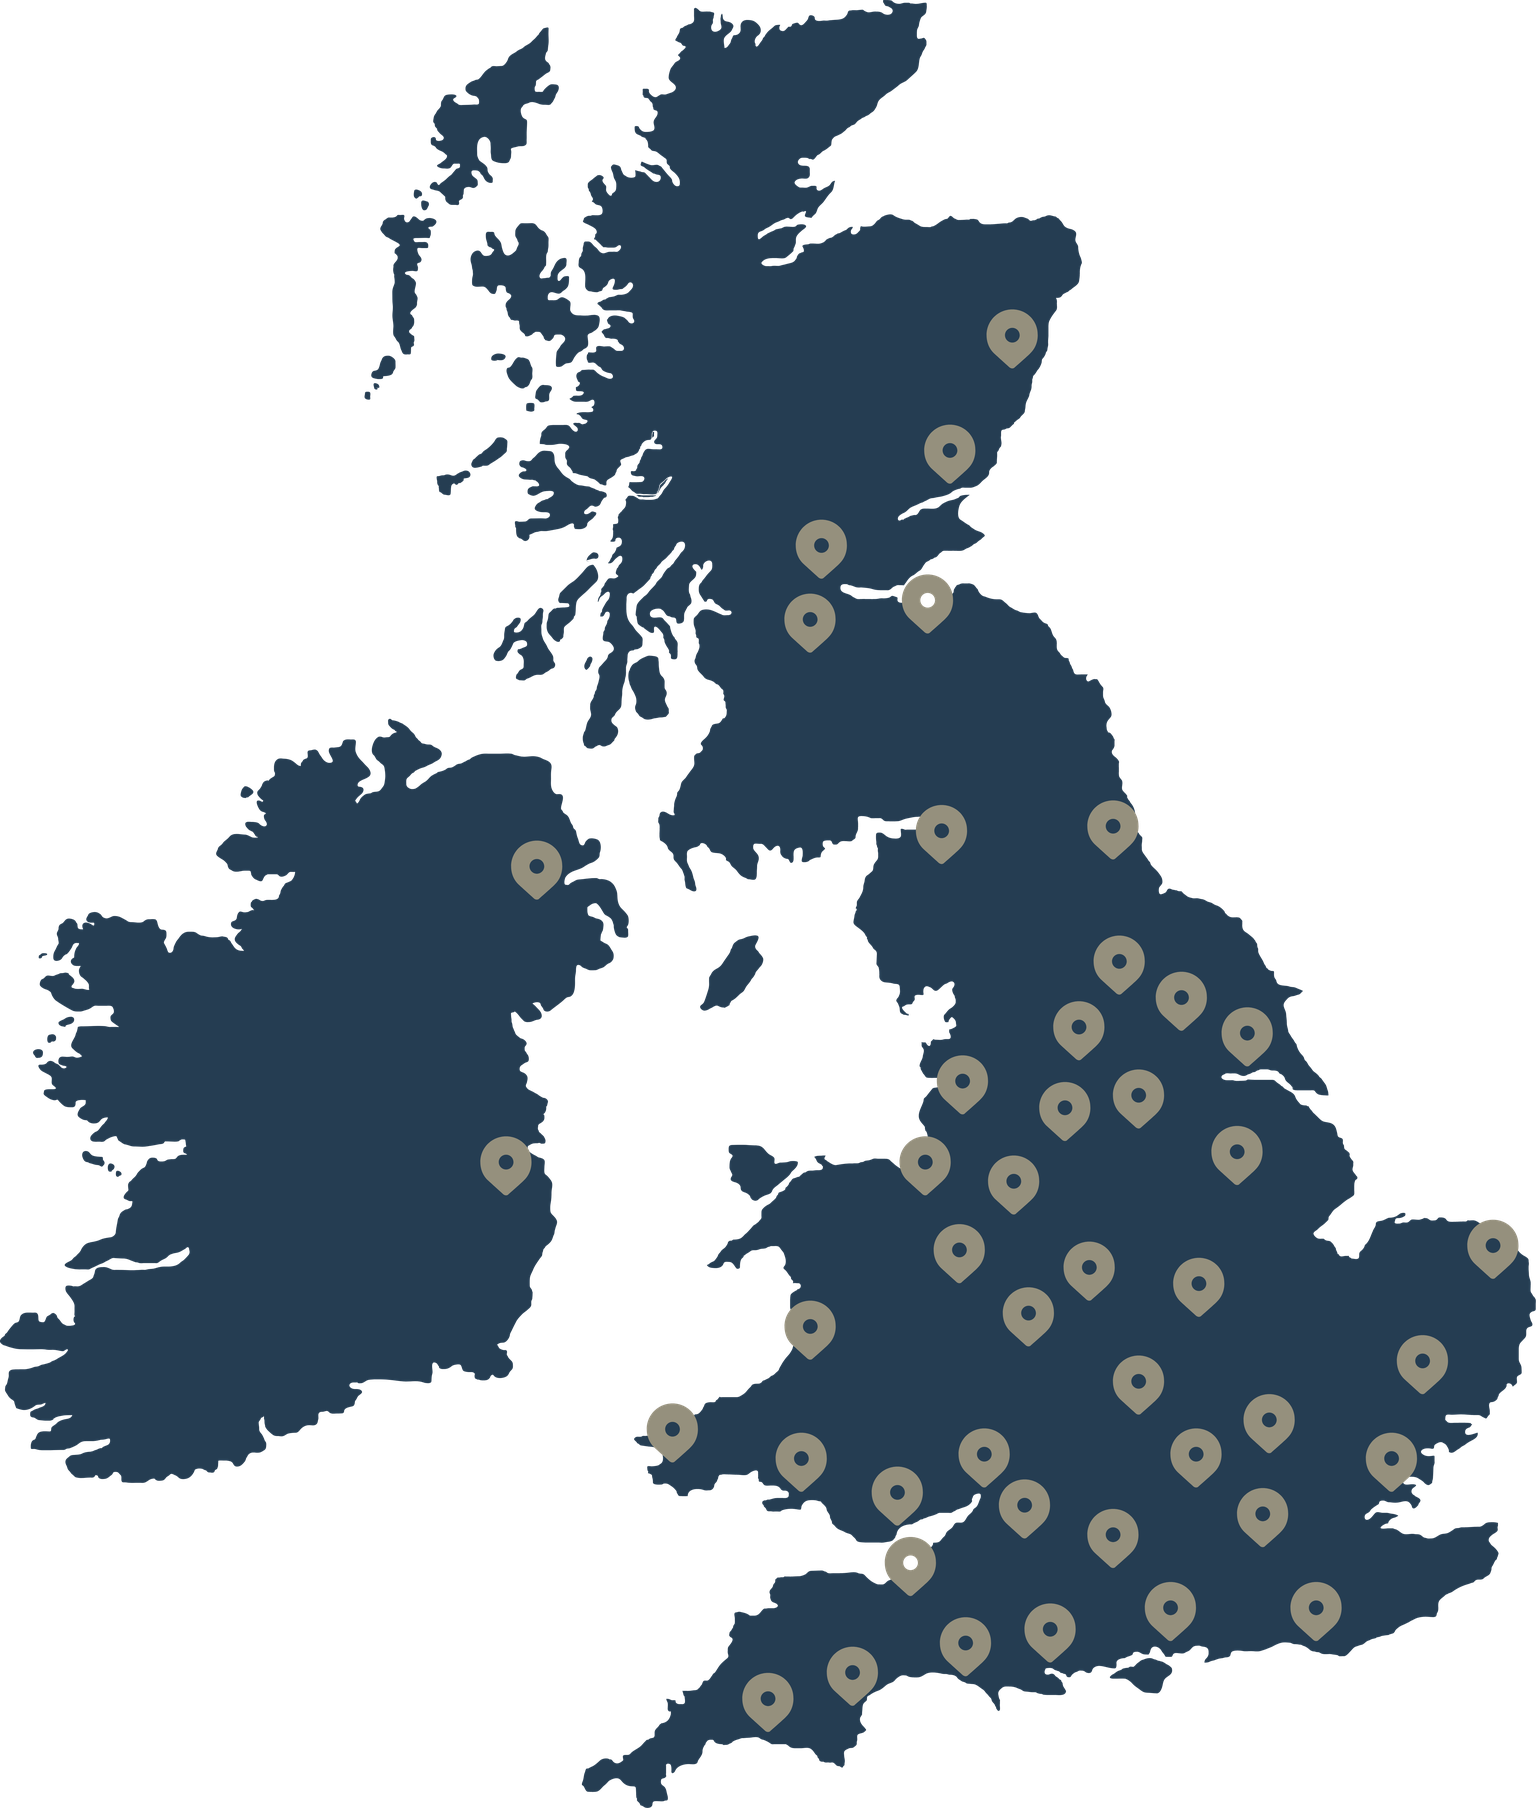
So, to understand the pressures at a local level, Opera Beds sent Freedom of Information (FOI) requests to 86 major local authorities across the UK. We asked how many households were waiting for wheelchair accessible housing as of the end of March 2026, and how many households with this need had been rehoused in a suitable home during 2025/26.
Only 11 authorities provided data that could be compared on a like-for-like basis. This comparable dataset allows us to build a small picture of the accessible housing gap, but we used wider council responses and government data to help show how demand for accessible housing is recorded, managed and addressed across the country.
Did you know?
Accessible housing standards typically focus on the design and layout of the property itself, such as step-free access, wider doorways, circulation space, and adaptable bathrooms. Equipment can be used to enhance the accessibility of an environment and enable individuals to optimise their independence. This can include equipment such as adjustable beds or mobility aids.
You may also be eligible for a free hospital bed at home. Depending on your circumstances, hospital beds can be provided through the NHS, local councils or charities. Read our guide on how to get a hospital bed for free to explore the available options.
Key takeaways
-
Accessible housing is not managed consistently across England: Only 50 local authorities, or 16.9%, maintain a dedicated accessible housing register or waiting list.
-
Wigan recorded the largest wheelchair accessible housing waitlist in the comparable dataset, with 383 households waiting compared to 86 already rehoused.
-
As of March 2026, Luton had the largest gap between those waiting for a suitable home and those who had been rehoused: There were nearly 12 households still waiting for every successful rehousing.
-
National comparisons are difficult: councils use different definitions, report figures for different dates and count lettings, offers and rehoused households in different ways.
Key terms used in this report
Accessible housing can mean different things depending on someone’s needs and how individual councils record their homes.
In this report, wheelchair accessible housing means a home that a council records as suitable or adapted for a wheelchair user. This may include homes designed with features such as step-free access and enough space to move around in a wheelchair.
Suitable rehousing is the term used in this report when a household needing wheelchair accessible housing begins a permanent social or affordable-rented tenancy in a property the council records as meeting that household’s wheelchair-accessibility requirements.
Accessible, adapted or adaptable housing is a broader term covering homes that have been designed or changed to make everyday living easier for people with mobility or accessibility needs, or that can be adapted as those needs change.
Because councils use different definitions and recording systems, we have only compared areas where the information provided was similar enough to make a fair comparison.
We also refer to Choice-Based Lettings (CBL), a system that allows people on a housing register to view available social homes and express an interest in suitable properties.
Local Authority Housing Statistics (LAHS) refers to the annual government data on local authority housing in England. We use this data to understand how councils record and advertise accessible housing more widely.
Where are the pressures greatest for wheelchair accessible properties?
To understand where pressure on wheelchair accessible housing is greatest, we compared the number of households waiting for a suitable home at the end of March 2026 with the number successfully rehoused during 2025/26 across 11 local authorities.
This gives us a ratio showing how many households were still waiting for every household that had been rehoused. For example, Luton's ratio of 11.9 means that almost 12 households were waiting for every one household rehoused in a suitable property. This is a measure of housing pressure, not an estimate of waiting time.

|
Rank |
Local authority |
Households waiting for wheelchair accessible housing as of March 2026 |
Completed rehousings from April 2025 to March 2026 |
Households still waiting per suitable rehousing |
|
1 |
Luton |
227 |
19 |
11.9 |
|
2 |
Milton Keynes |
63 |
6 |
10.5 |
|
3 |
Plymouth |
71 |
9 |
7.9 |
|
4 |
Kingston upon Thames |
130 |
18 |
7.2 |
|
5 |
Portsmouth |
99 |
14 |
7.1 |
|
6 |
Southend-on-Sea |
19 |
3 |
6.3 |
|
7 |
Wigan |
383 |
86 |
4.5 |
|
8 |
Exeter |
28 |
7 |
4.0 |
|
9 |
Westminster |
67 |
30 |
2.2 |
|
10 |
Peterborough |
21 |
10 |
2.1 |
|
11 |
Stockport |
33 |
19 |
1.7 |
Luton: 11.9 households waiting per suitable rehousing
Luton recorded 227 households waiting for wheelchair accessible housing against 19 suitable rehousings, resulting in the highest ratio in the comparable dataset. The council’s accessible housing register records three levels of wheelchair accessibility, covering homes with external and level internal access, wheelchair access to essential rooms, and full wheelchair access throughout the property.
Milton Keynes: 10.5 households waiting per suitable rehousing
Milton Keynes recorded 63 households waiting and 6 suitable rehousings. Its figures combine households requiring fully wheelchair accessible housing with those requiring wheelchair access to essential rooms only.
Plymouth: 7.9 households waiting per suitable rehousing
Plymouth recorded 71 households waiting and 9 suitable rehousings. Its wheelchair category applies to applicants who require a home they can enter and move around in using a wheelchair, and are likely to use a wheelchair full-time or regularly for prolonged periods.
Stockport: 1.7 households waiting per suitable rehousing
At the other end of the comparable range, Stockport recorded 33 households waiting and 19 suitable rehousings, equivalent to 1.7 households waiting for every household rehoused. Stockport’s figures cover applicants who require wheelchair accessible or adapted accommodation for full-time wheelchair use.
What councils across the UK told us
The 11 authorities that supplied comparable data are only one part of the investigation. Many other councils supplied useful figures, but these could not be included in the ranking because their responses used different definitions, dates or scopes. For example, some councils reported accessible-property lettings or offers rather than the number of wheelchair-user households that had completed a suitable move.
These figures help show local demand, but they should not be compared directly with the main table or with one another unless the underlying measures align.
London
Two London authorities are included in the comparable ranking. Kingston upon Thames recorded 130 households waiting for wheelchair accessible housing and 18 suitable rehousings, equivalent to 7.2 households waiting per suitable rehousing. Westminster recorded 67 households waiting and 30 suitable rehousings, equivalent to 2.2.
Across London more broadly, 13 of 33 authorities (39.4%) maintain an accessible housing register or waiting list, and 21 of 33 (63.6%) advertise accessible properties through CBL.
East of England
Three East of England authorities are included in the comparable ranking. Luton recorded 227 households waiting and 19 suitable rehousings, equivalent to 11.9 households waiting per suitable rehousing. Southend-on-Sea recorded 19 households waiting and 3 suitable rehousings, equivalent to 6.3, while Peterborough recorded 21 households waiting and 10 suitable rehousings, a ratio of 2.1.
Across the region, 9 of 45 authorities (20.0%) maintain an accessible housing register or waiting list, and 38 of 45 (84.4%) advertise accessible properties through CBL.
West Midlands
The West Midlands did not have any councils with data that could be directly compared with the 11 authorities in the main analysis. However, the wider FOI responses still give an indication of local demand.
Birmingham recorded 419 households needing wheelchair accessible housing, the highest figure reported in the wider FOI data. However, Birmingham provided its information for a different date and reported the number of suitable properties let, rather than the number of wheelchair-user households rehoused.
Coventry recorded 114 households waiting for wheelchair accessible housing. It also reported the number of accessible properties let rather than the number of households that moved into a suitable home.
Across the West Midlands, 6 of 30 councils (20.0%) have an accessible housing register or waiting list, and 24 (80.0%) advertise accessible properties through CBL.
Yorkshire & the Humber
No authority from Yorkshire & the Humber is included in the main comparable ranking, although several councils reported local demand for wheelchair accessible housing.
Wakefield recorded 291 households waiting and 70 suitable rehousings. However, wheelchair use was reported by applicants, and it was not clear whether the waiting and rehousing figures covered the same types of housing.
Hull recorded 98 households waiting and no suitable rehousings. Again, wheelchair use was reported by applicants rather than recorded through a clearly defined assessment. York recorded 25 households waiting but did not have a corresponding figure for households rehoused.
Across Yorkshire & the Humber, 3 of 15 authorities (20.0%) maintain an accessible housing register or waiting list, and 12 of 15 (80.0%) advertise accessible properties through CBL.
North West
Two North West authorities are featured in the comparable ranking. Wigan recorded 383 households waiting and 86 suitable rehousings, a ratio of 4.5. Stockport recorded 33 households waiting and 19 suitable rehousings, equivalent to 1.7.
Across the region, 5 of 35 authorities (14.3%) maintain an accessible housing register or waiting list, and 31 of 35 (88.6%) advertise accessible properties through CBL.
South East
Two South East authorities are included in the comparable ranking. Milton Keynes recorded 63 households waiting and 6 suitable rehousings, equivalent to 10.5 households waiting per suitable rehousing. Portsmouth recorded 99 households waiting and 14 suitable rehousings, equivalent to 7.1.
Other councils reported substantial local demand but recorded their figures differently, so cannot be directly compared: Reading reported 151 waiting, Brighton & Hove 140, Southampton 57 and Sutton 33.
Across the region, 9 of 64 authorities (14.1%) maintain an accessible housing register or waiting list and 51 of 64 (79.7%) advertise accessible properties through CBL.
East Midlands
FOI responses from the East Midlands show demand for wheelchair accessible housing, although differences in how councils recorded their figures meant none could be included in the main comparison.
Nottingham recorded 350 households waiting and 37 suitable rehousings. However, it was unclear how the council defined wheelchair accessible housing and whether both figures covered the same types of housing.
Derby recorded 290 households waiting and Leicester 126. Both councils reported the number of accessible properties let, rather than the number of households that moved into a suitable home.
Across the East Midlands, 3 of 35 councils (8.6%) have an accessible housing register or waiting list, and 29 (82.9%) advertise accessible properties through CBL.
South West
Plymouth and Exeter are both included in the comparable dataset. Plymouth recorded 71 households waiting and 9 suitable rehousings, giving 7.9 households waiting per suitable rehousing. Exeter recorded 28 waiting and 7 suitable rehousings, giving 4.0. Across the South West, 2 of 27 authorities (7.4%) maintain an accessible housing register or waiting list and 23 of 27 (85.2%) advertise accessible properties through CBL.
North East
In the North East, differences in the data meant no councils could be included in the main comparison.
North Tyneside recorded 43 households waiting and 8 suitable rehousings. However, the council does not separately record households assessed as needing wheelchair accessible housing, and its figures do not include homes provided by housing associations and other registered providers.
Middlesbrough recorded 71 households waiting, although information about wheelchair needs is not required from every applicant, meaning the figure may not capture everyone who needs a wheelchair accessible home. The number of households rehoused was not published because the figure was too small to disclose.
None of the 12 councils in the North East has an accessible housing register or waiting list. Ten (83.3%) advertise accessible properties through CBL.
Scotland
No Scottish authority is included in the 11-authority comparable ranking, and the LAHS data used for the England-wide management analysis does not cover Scotland. The wider FOI responses included figures from Aberdeen, Dundee, Highland, North Lanarkshire and South Lanarkshire, but differences in what the figures covered or the information councils held mean they are best treated as individual local examples rather than a direct comparison between Scottish councils.
How councils across England manage accessible housing
The FOI responses show how difficult it is to create one consistent national measure of wheelchair-user housing demand. To add wider context, we analysed the latest LAHS for England2, looking at how councils identify and advertise accessible housing more generally.
The national data shows that there is no single approach. Only 50 English authorities (16.9%) maintain an accessible housing register or waiting list. A further 197 (66.6%) do not maintain a dedicated register but identify whether properties are accessible before letting, while 43 (14.5%) do not maintain an accessible housing register.
When it comes to advertising, 239 authorities (80.7%) advertise accessible properties through Choice-Based Lettings. CBL allows eligible applicants to view available social homes and express an interest in suitable properties. Importantly, this figure shows the route used to advertise accessible homes – it does not indicate how many accessible properties are available.
Where are accessible housing registers most common?
The LAHS data also shows regional variation in the way accessible housing is managed and advertised. These differences should not be interpreted as a league table of council performance or housing supply.

|
Region |
Authorities |
% maintaining an accessible register/waiting list |
% advertising accessible properties through CBL |
|
London |
33 |
39.4% |
63.6% |
|
East of England |
45 |
20.0% |
84.4% |
|
West Midlands |
30 |
20.0% |
80.0% |
|
Yorkshire & the Humber |
15 |
20.0% |
80.0% |
|
North West |
35 |
14.3% |
88.6% |
|
South East |
64 |
14.1% |
79.7% |
|
East Midlands |
35 |
8.6% |
82.9% |
|
South West |
27 |
7.4% |
85.2% |
|
North East |
12 |
0.0% |
83.3% |
London has the highest proportion of authorities maintaining an accessible housing register or waiting list, at 39.4%, while none of the 12 North East authorities report maintaining one. CBL use follows a different pattern: 63.6% of London authorities advertise accessible properties through CBL, compared with 88.6% in the North West. Again, these figures describe systems and processes, not the volume or suitability of accessible homes available in each region.
What does having a wheelchair accessible house mean for independence?
Barbara Franks, Occupational Therapist working with Opera Beds, explains why finding an accessible home is about more than how a property is labelled:
“Having somewhere to live and having a home that genuinely meets your needs can be two very different things. For someone with limited mobility or who uses a wheelchair, the layout and accessibility of their home can affect many parts of everyday life, from moving safely between rooms to washing, preparing meals and getting in and out of bed.
“It’s also important to remember that accessibility isn’t one-size-fits-all. Two people who both use wheelchairs may have very different levels of mobility, strength and support needs. A property described as ‘accessible’ may work well for one person but still present significant barriers for another.
“That’s why the individual needs to be at the centre of decisions about housing and adaptations. Things like step-free access and wider doorways can be important, but so can the height of surfaces, the bathroom layout, accessibility of the kitchen, assistive technology and the space available for transfers. This can all affect whether someone can move comfortably and confidently around their home.”
Planning for changing mobility needs
Mobility needs can also change over time, as Barbara notes:
“Mobility isn’t always static. Someone may be able to manage their home independently now but need additional support in the future, whether because of ageing, a progressive condition or a change in their circumstances.
“Where possible, thinking ahead can make a real difference. A home that can be adapted as someone’s needs change may help them maintain their independence without having to make another major move simply because their existing environment no longer works for them.”
The role of the bedroom in an accessible home
Accessibility extends beyond the structure of the property itself. The way individual rooms are set up, and the equipment within them, can influence how independently someone can manage everyday routines. Barbara adds:
“The bedroom is a good example of why we need to look at the whole living environment. For someone with reduced mobility, something as everyday as getting into or out of bed can become difficult if the height or positioning of the bed doesn’t work for them.
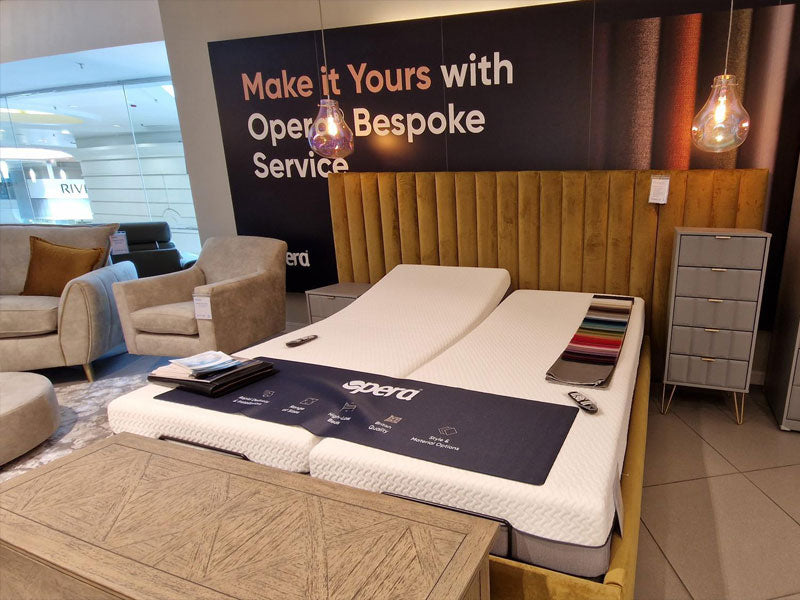
“The right equipment can sometimes make those routines easier. Depending on the person’s needs, a profiling bed may support positioning or provide height adjustment that can help with getting in and out of bed and with assisted transfers.”
The accessible housing gap is bigger than one ranking
The findings show that understanding demand for wheelchair accessible housing is not straightforward. While the comparable data gives an indication of the pressure in different areas, it also highlights how much depends on the way councils record housing needs and suitable homes.
For people looking for an accessible home, those differences matter. Knowing that a property is available is only useful if it genuinely meets the needs of the person who will live there. Clearer and more consistent information could help build a better picture of demand and make it easier to understand whether suitable homes are reaching the households that need them.
Methodology
Freedom of Information requests
We submitted Freedom of Information requests to local authorities seeking the number of active households recorded as requiring wheelchair-user housing at 31 March 2026, and the number of those households that began a permanent social or affordable-rented tenancy in a property recorded as meeting that requirement during 2025/26.
We only directly compared authorities that supplied sufficiently comparable wheelchair-specific waiting-list and completed-tenancy figures. Responses using broader mobility or adapted-housing categories, alternative dates, property-level lettings rather than household rehousings, offers rather than completed tenancies, or different allocation scopes were excluded from the main ranking and used only as supporting findings.
The ratio shows the number of households recorded as waiting at the snapshot date for every suitable tenancy completed during the year; it shouldn’t be interpreted as an estimated waiting time.
Government accessibility data
We also analysed the latest Local Authority Housing Statistics (LAHS) published by the Ministry of Housing, Communities and Local Government for 2024/25. This covers local authorities in England and was used to examine whether councils advertise accessible properties through choice-based lettings and whether they maintain a dedicated accessible housing register or waiting list.
LAHS also reports households given reasonable preference on medical or welfare grounds, including disability. Note that this measure covers a wider group than wheelchair users.
Sources
1. Social housing lettings in England, tenants: April 2024 to March 2025 - Ministry of Housing, Communities and Local Government
2. Local Authority Housing Statistics data returns for 2024 to 2025 - Ministry of Housing, Communities and Local Government